Measure of Risk and Analytics Derivatives
Quantitative portfolio risk management often relies on statistical measures
related to the spread or the tails of the distribution of portfolio returns. Such
measures include variance and standard deviation (spread), coefficient of
variation (risk relative to mean), and percentiles of the distribution (tails).
Value-at-risk and conditional value-at-risk are the financial terms used to
describe two popular risk measures based on the percentiles of the distribution
of portfolio returns. Below we explain the statistical measures and their
corresponding portfolio risk measures in more detail.
Variance and Standard Deviation When thinking of risk, one usually
thinks of how far the actual realization of an uncertain variable will
fall from what one expects. Therefore, a natural way to define a measure
of uncertainty is as the average spread or dispersion of a distribution. Two
measures that describe the spread of the distribution are variance and standard
deviation. The two are strongly related: the standard deviation is the
square root of the variance, and we usually need to compute the variance
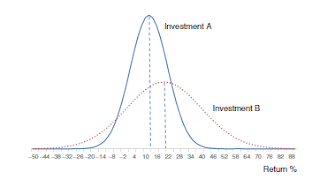
before computing the standard deviation. Exhibit 2.9 illustrates the relationship
between variance/standard deviation and the spread of the distribution.
Suppose we are considering investing in two assets, A and B.
Coefficient of Variation Let us consider again the picture in
Exhibit 2.9. We mentioned that the probability distribution for A has
a smaller standard deviation than the probability distribution for B, but
notice also that the mean of the distribution for A is lower than the mean for
the distribution for B. If you had to invest in one of them, which one would
you choose? This is a situation in which one may want to measure spread
(the “risk” of the distribution) relative to the mean (the “representative”
value of the distribution). This is the concept behind coefficient of variation
(CV), which is reported as a percentage, and is mathematically expressed as
CV = 𝜎
𝜇
× 100
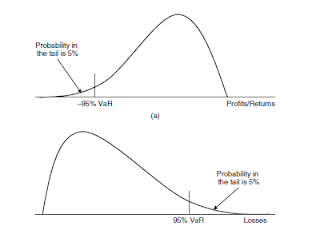
Value-at-Risk Value-at-risk (VaR) is related to the statistical
measure percentile. VaR measures the predicted maximum portfolio dollar
loss at a specified probability level over a certain time horizon. Commonly
used probability levels include 0.95 and 0.99, and the corresponding VaR
is referred to as 95% VaR and 99% VaR (in other words, the probability is
stated as a percentage). Typical time horizons include 1 day and 10 days.
The portfolio loss is defined as the difference between the initial value of
the portfolio at the current time t, Vt, and the future value of the portfolio
at time t + 1, Vt+1.4


